MetAML - Metagenomic prediction Analysis based on Machine Learning
MetAML is a computational tool for metagenomics-based prediction tasks and for quantitative assessment of the strength of potential microbiome-phenotype associations. The tool (i) is based on machine learning classifiers, (ii) includes automatic model and feature selection steps, (iii) comprises cross-validation and cross-study analysis, and (iv) uses as features quantitative microbiome profiles including species-level relative abundances and presence of strain-specific markers.
It provides also species-level taxonomic profiles, marker presence data, and metadata for 3000+ public available metagenomes.
Software and data repository and supporting material
The software and data repository of MetAML:
https://github.com/segatalab/metaml
The supporting user group of MetAML:
https://groups.google.com/forum/#!forum/metaml-users
The tutorial of MetAML:
https://github.com/segatalab/metaml/wiki
For comments and questions please refer to the supporting user group linked above or contact directly us.
Citation
Machine learning meta-analysis of large metagenomic datasets: tools and biological insights
PLOS Computational Biology 2016 10.1371/journal.pcbi.1004977
1 Centre for Integrative Biology, University of Trento, Trento, Italy
2 Graduate School of Public Health and Health Policy, City University of New York, New York, United States of America
Some examples

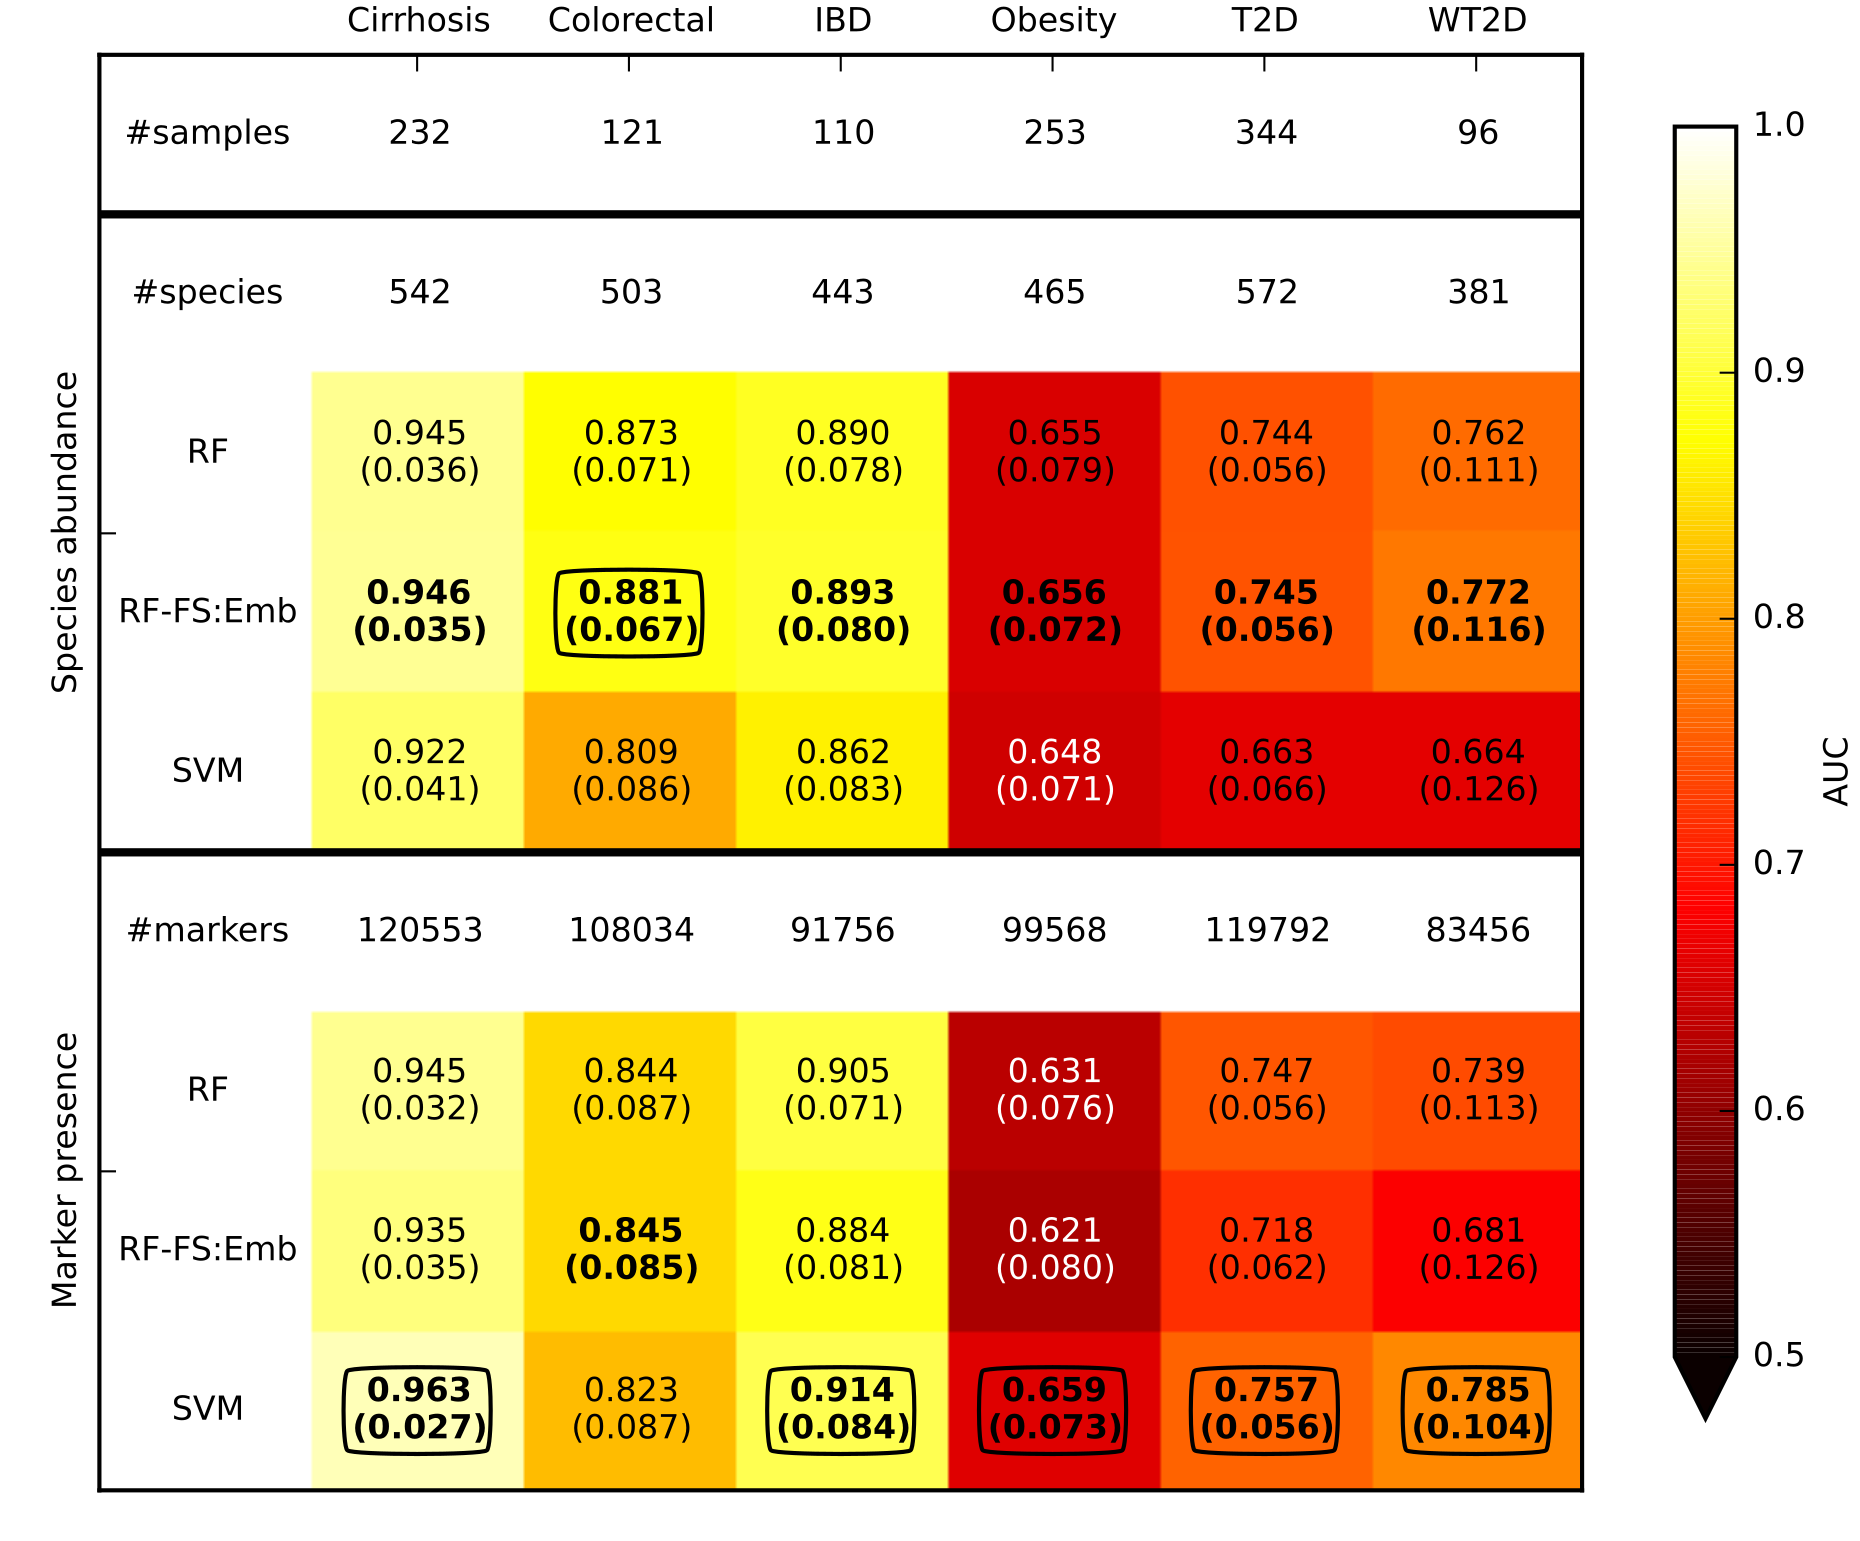
Prediction performances (assessed using AUC) for disease discrimination in different cross-validation studies. Species abundance and marker presence are the microbiome features used by the classifiers. The best value for each dataset and feature type (i.e., species abundance and marker presence) are in bold, and the overall best values for each dataset are circled. SVM and RF are applied on the entire set of features whereas RF-FS:Emb incorporates a feature selection step. Margins of error are reported in parenthesis.

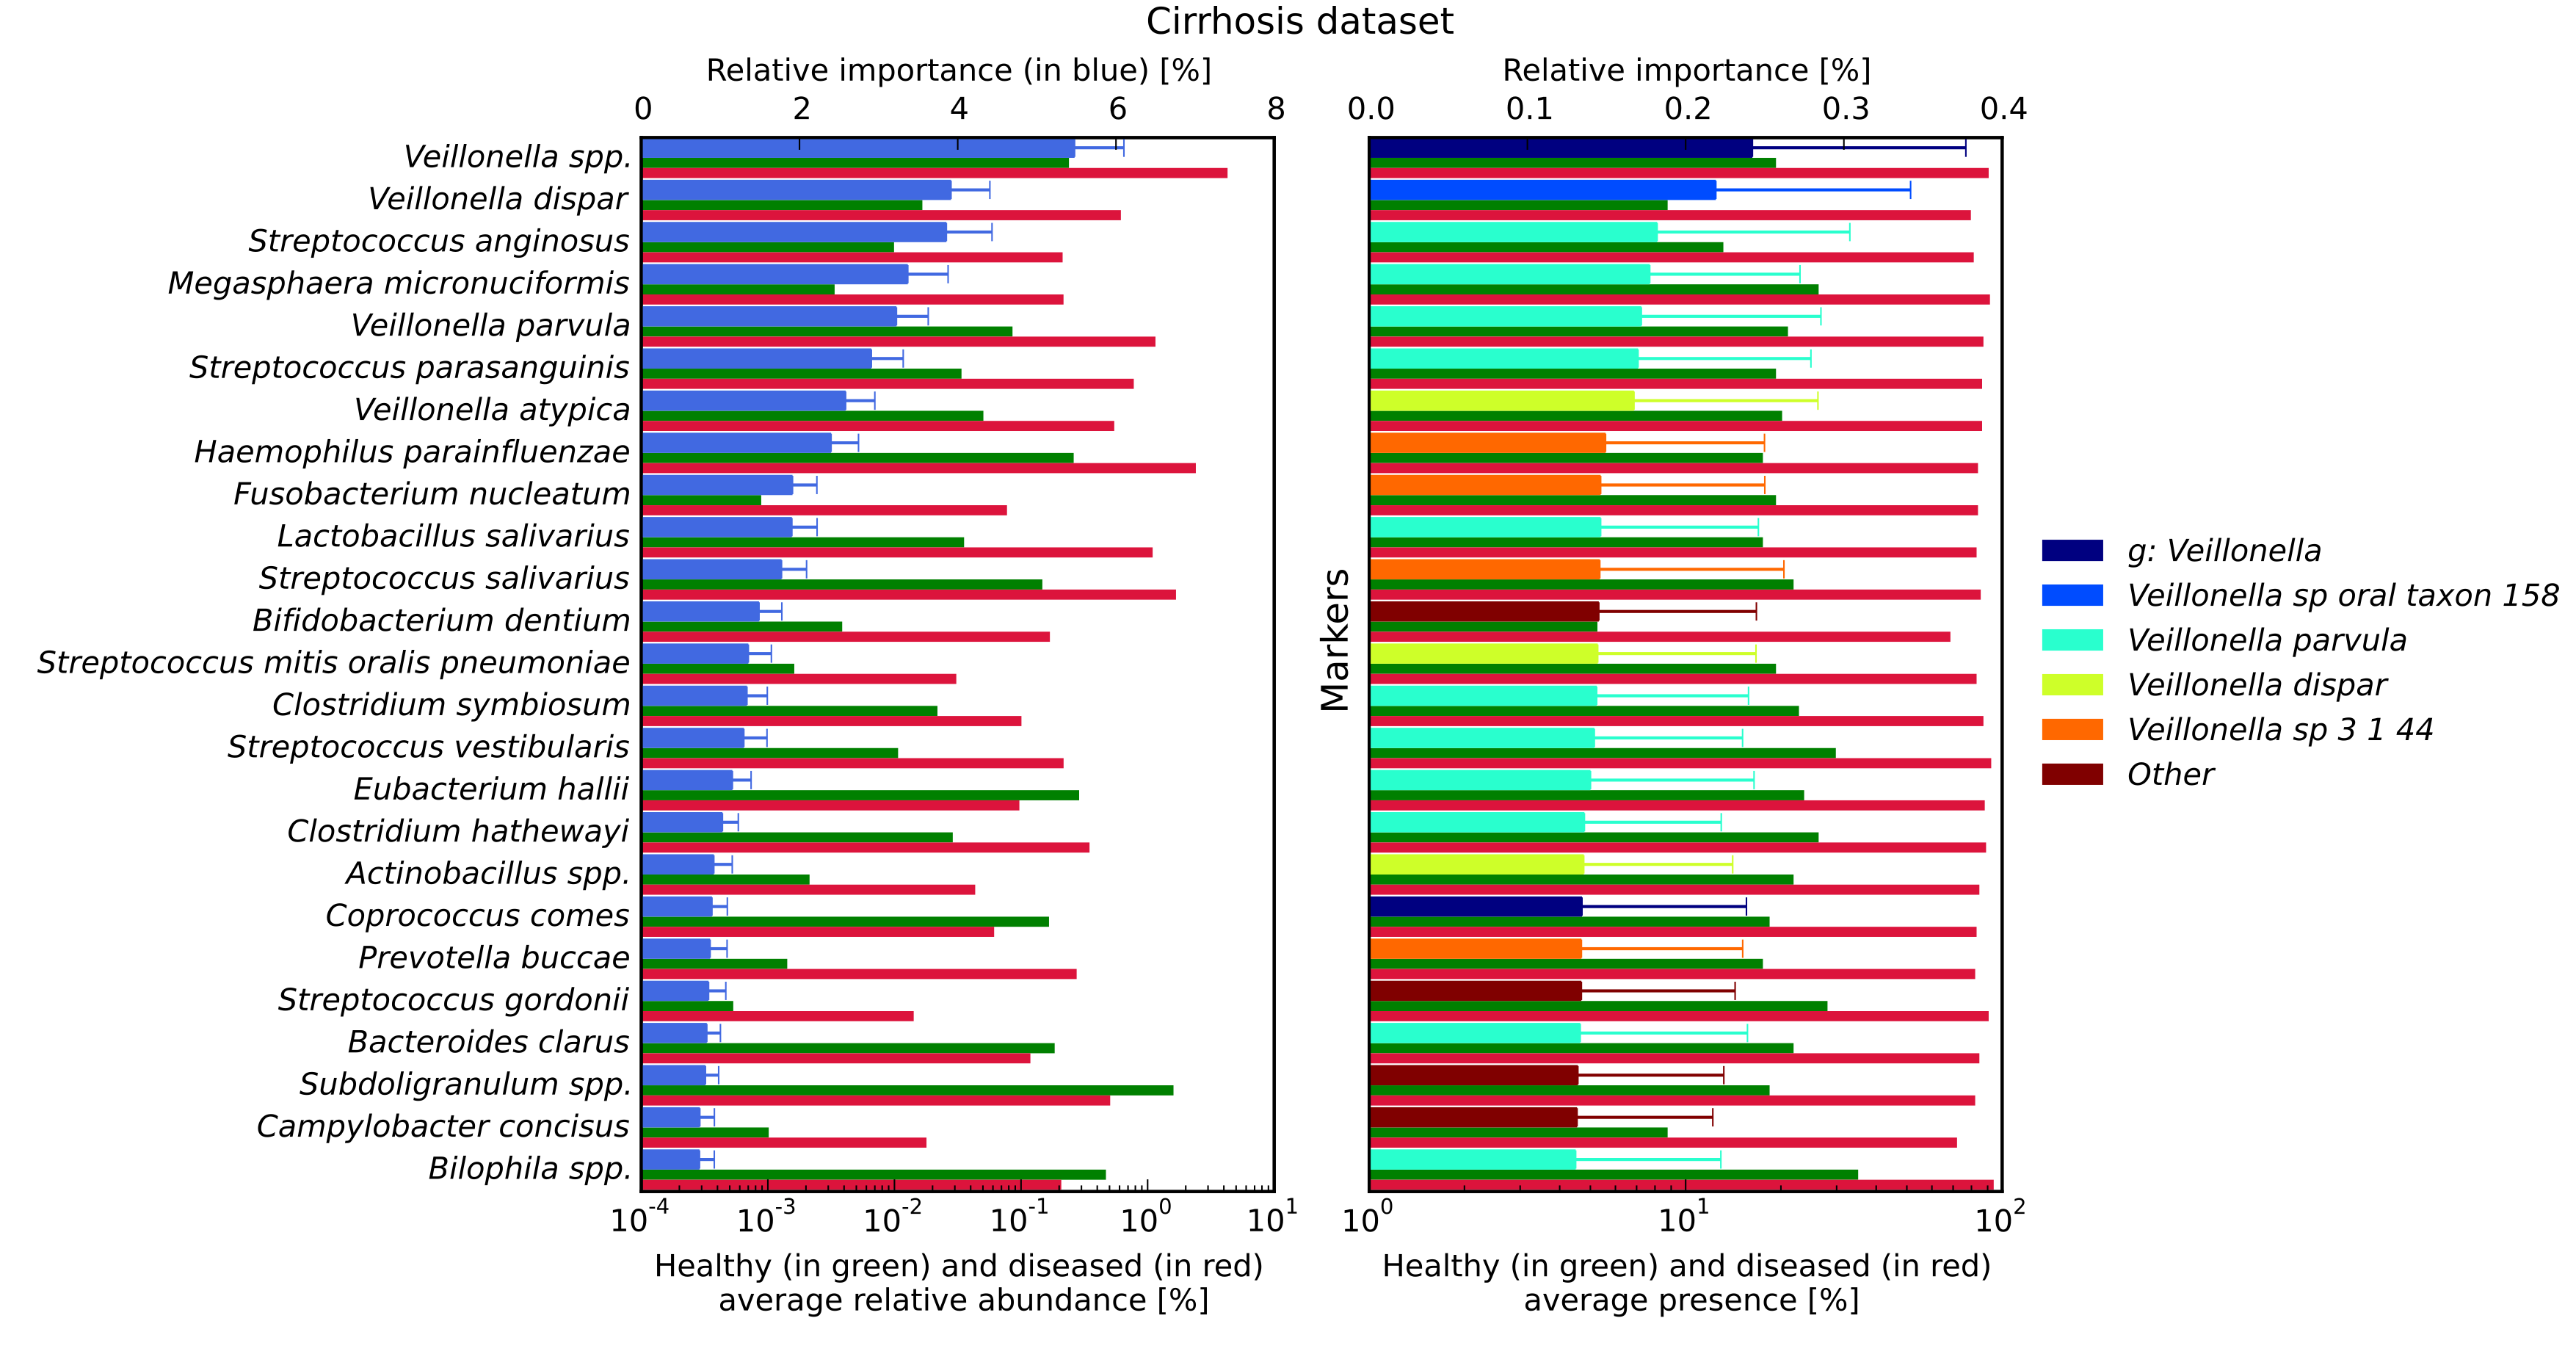
Most important discriminating species (left) and markers (right) identified by RF for disease discrimination in the cirrhosis dataset. In the left panel, for each species reported on the vertical axis, the top bar (in blue) corresponds to the feature relative importance (with standard deviation reported with error bars) and the two bottom bars refer to the average relative abundance for healthy (in green) and diseased (in red) samples. In the right panel, for each marker the top bar is coloured according to the corresponding species and the two bottom bars refer to the average marker presence.


